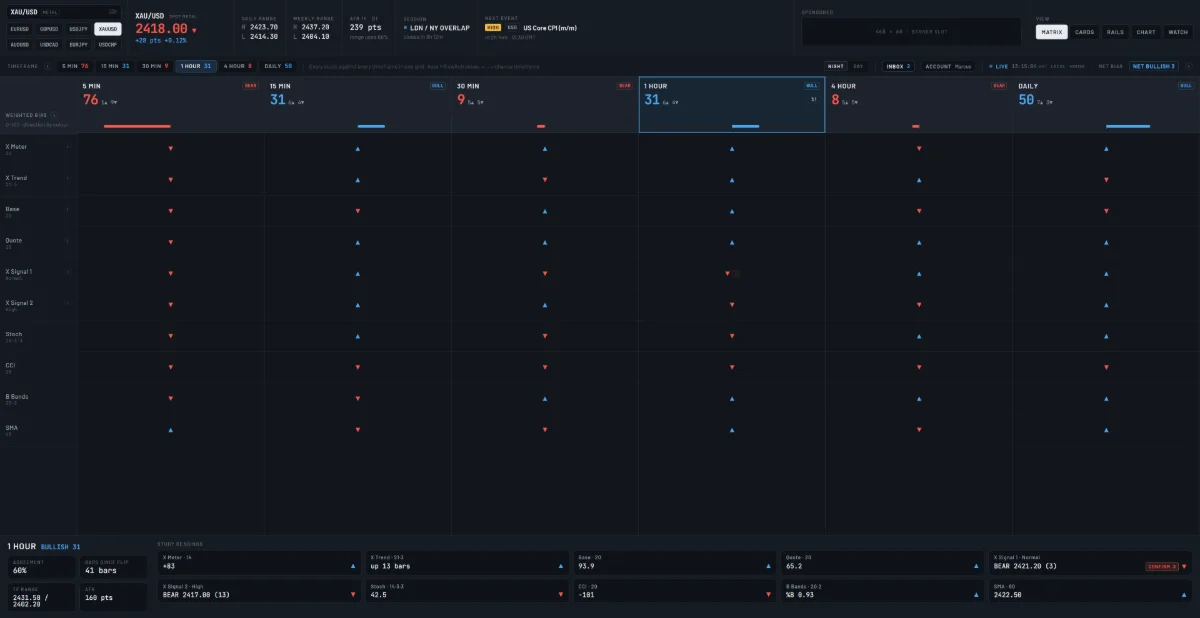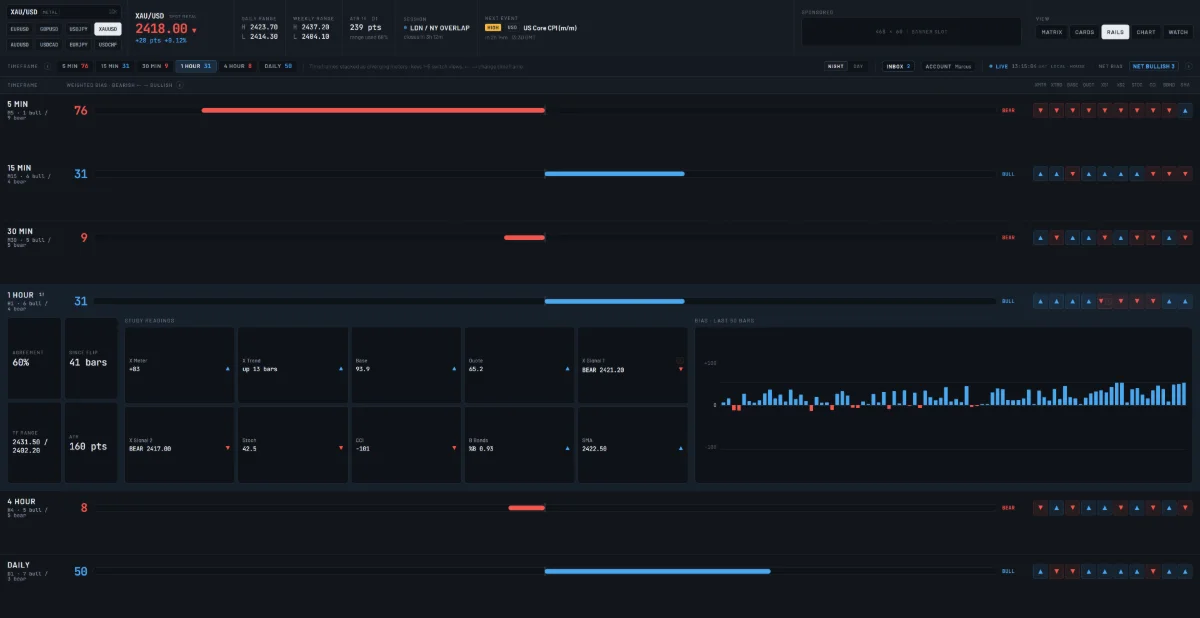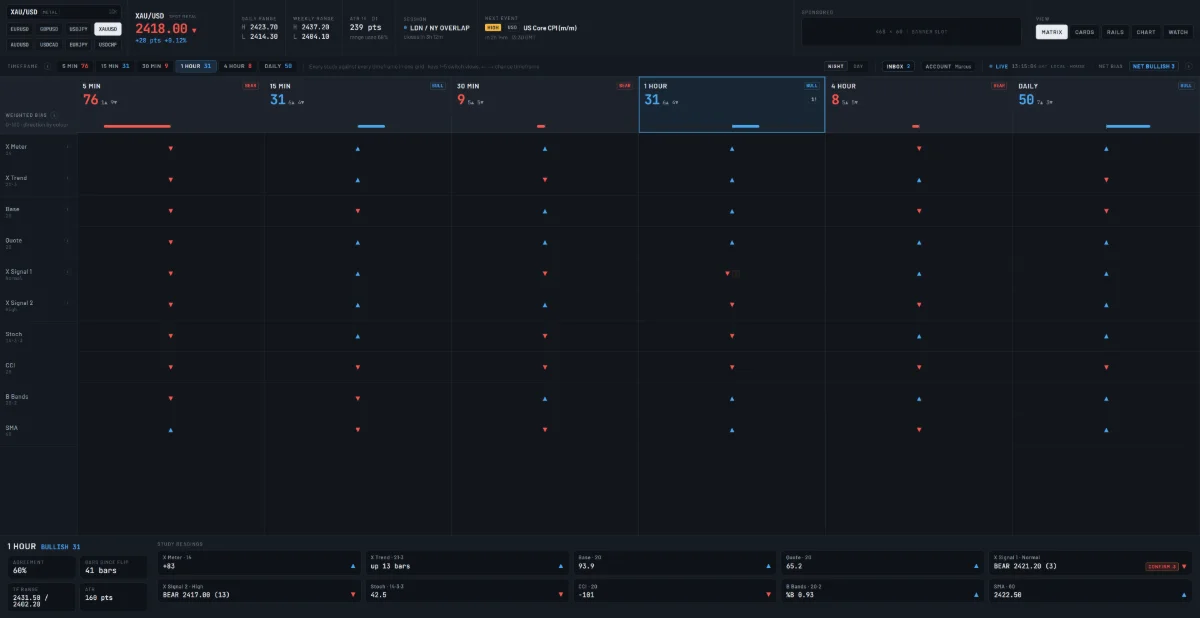
If you run studies on more than one timeframe, you know the routine. You flick between charts and memory does the rest. The H1 that agreed with you sticks. The D1 that didn't fades. That is where guessing creeps in. The problem is rarely too little data. It is data spread across too many screens. 4Xedge Bias Terminal puts it in one place. It measures how far your own studies agree across the timeframes you choose, and reports what they printed.
What the terminal shows you
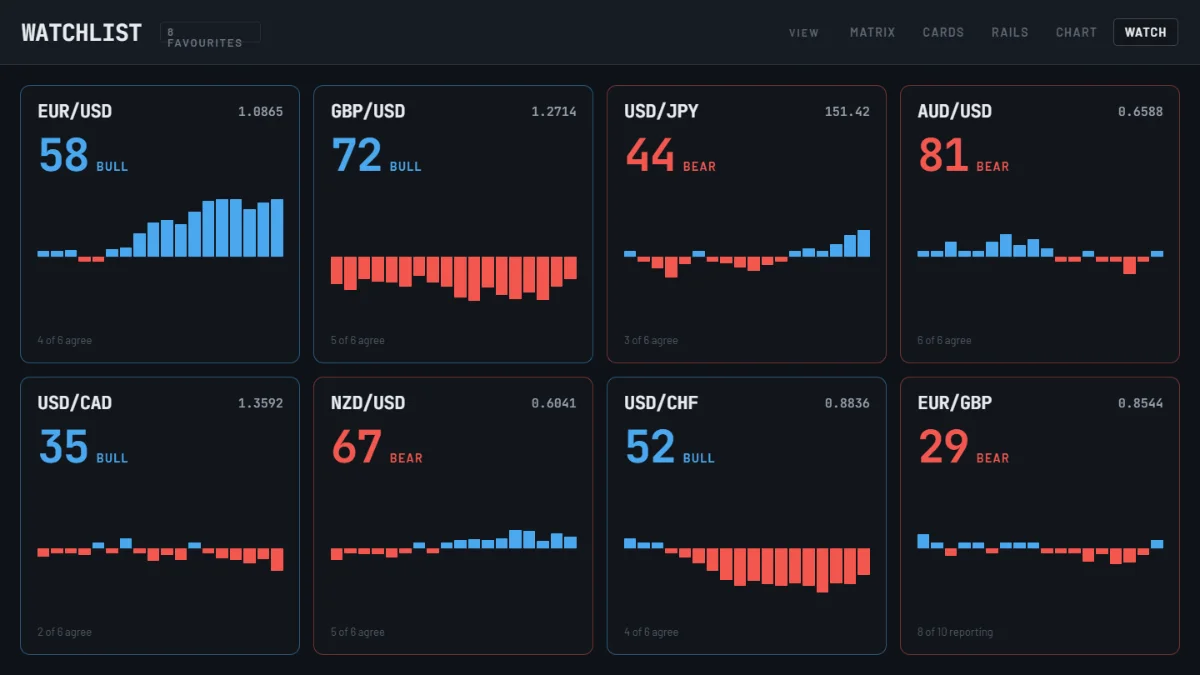
The desk's default set reads M5, M15, M30, H1, H4 and D1. You can swap that for any 3 to 6 of 23 timeframes, so the set matches how you actually trade. On the watchlist, each pair gets its own card. It carries a bull or bear label, a score, a row of bars and a line saying how many of your timeframes agree. You see the agreement, or the split, at a glance instead of rebuilding it chart by chart.
The decision stays with you
The terminal never gives signals, ranks setups or grades trades. It does one job. It turns “I think H4 is with me” into what your H4 study actually printed. An educated decision starts from what you can check, not what you remember. If your timeframes line up, you see it. If they pull apart, you see that too. What you do with it is your call, made on your own studies and your own rules.
“Read what your studies printed. Then make your own call.”