4Xedge Bias — free multi-timeframe forex bias terminal
My Account My Terminal
FOLLOW
4Xedge BIAS TERMINAL
Home Framework Watch Research Blog Support
Free account!
FREE · NO CARD · ACCOUNT REQUIRED · NO UPSELL LATER 

Spend Less Time Guessing

& More Time Deciding

There's a better way to read financial markets, and we can show you. One screen reads six timeframes at once and tells you how much of the stack is pointing the same way — no signals, no execution, no promises*.

Create your free account See the five views
* Trading involves substantial risk of loss and is not suitable for all investors. Make sure you understand the risks involved, seeking independent advice if necessary. Past performance is not indicative of future results.
WELCOME TO 4Xedge Bias Terminal

Not a trading system. A framework for the one you already have.

Powerful multi-timeframe analysis with a simple learning curve.

We do not sell you a method. There is no black box deciding what a good trade looks like, no house strategy you are quietly being fitted to, and nothing that says buy or sell. 4Xedge Bias Terminal is the measurement layer underneath whatever you already run — a framework that takes the reading you would otherwise assemble by hand across six charts and puts it on one screen*.

That makes it a workflow tool first. The slots are yours: pick the studies, pick the periods, save the set. Because a set is just a configuration, it is also portable — hand it to someone else as a code and they see exactly what you see, on the same timeframes, under the same studies. Ideas stop being screenshots and start being something two traders can actually check against each other.

HOW THE FRAMEWORK RUNS
3 STAGES
01
YOUR METHOD Bring your own rules. We measure agreement, we never rank a setup or grade a trade.
RSI 14 MACD 12·26·9 EMA 200 + 7 SLOTS EMPTY
02
YOUR WORKFLOW Six charts of manual comparison collapse into one reading you can take in at a glance.
M5
M15
H1
H4
D1
W1
→
58 NET BULLISH
03
SHARED IDEAS A set is a code. Send it and the other trader sees your exact configuration, not a screenshot.
SET · 9F2C-71A →
YOU 58
THEM 58
MATRIX PRODUCT DEMO
RECORDED IN-APP
WHAT YOU JUST WATCHED

I've traded spot FX for 25 years and built this because I wanted it to exist.

Each study in your set reports a direction and a strength. The score adds those reports up and divides by the number of studies voting — nothing smoothed, nothing hidden, nothing tuned behind your back. That is the whole formula.

THE WHOLE FORMULA Σ(direction × strength)
———————————
(number of studies voting)
Equal weight per slot. Direction is ±1. Strength is read off the printed value, so a study screaming at 94 counts for more than one drifting at 12.
01 Direction is colour, conviction is the number — scores run 0–100 and are always positive; the colour says which way. A 91 and a 12 pointing the same way are not the same reading.
02 A silent study is a hole, never a zero — if a slot stops reporting, its weight is not handed to the others. The header reads 8/10 REPORTING and the score covers what actually spoke.
03 Every study is computed here, on your source’s bars — we never adopt another platform’s finished numbers, because that would make two traders’ scores incomparable.
04 Ninety bars of history under your current set — change a study and the strip behind every timeframe recomputes. You always see the history of the thing you are actually running.
05 Your screen, your slots — pick the studies, pick the periods, save the set — the score recomputes under exactly what you chose, and nothing is tuned behind your back.
* Every price, score and chart shown in this recording is illustrative placeholder content, not live market data and not a recommendation to enter or exit a position.

Try the multi-timeframe bias score

Create a free account and read any of the 112 symbols on the house feed across six timeframes at once, under the studies you chose*.

* A bias reading is a measurement, not a signal. It does not guarantee profitable or successful trades.

Trading involves substantial risk of loss and is not suitable for all investors. You should make sure you understand the risks involved, seeking independent advice if necessary. Past performance is not indicative of future results.

Get a free account

Why haven't I heard of 4Xedge Bias Terminal before?

Because we are new — sort of. The measurement has been running privately on a house feed for a long time while we got the honest parts right: what happens when a study stops reporting, what happens when the feed goes quiet, and what a number is allowed to claim when the history behind it is short.

Can I afford your service?

Yes. It is £0 — now and at renewal. The terminal is members-only for one unglamorous reason: it holds your configuration, and we need to know how many people are on the feed to size the hosting. It is paid for by sponsors and donations, never by you.

It stays free. The terminal never charges anybody for anything: no subscription, no tier, no upsell — and there is no card on file, because none was ever collected.

✓ Your configuration, favourites and presets are saved to your account.
✓ We email you only about your account: confirming your address, or resetting your password.
✓ Your details are never sold or handed to a broker, and are shared only as our Privacy Policy describes.
✓ No card is stored, because none is collected.
Let's get started
EUR/USD SPOT
LIVE 13:15:04 GMT
NET BIAS · 6 TIMEFRAMES
62 BEARISH
4 OF 6 TIMEFRAMES AGREE
1.09160 LOCAL · HOUSE
{{ t.k }} {{ t.arrow }} {{ t.score }}
BIAS · LAST 90 BARS illustrative, not market data
4–10 STUDY SLOTS From a library of 36 — the same study twice at different parameters if you want.
3–6 TIMEFRAME SLOTS Chosen from 23 periods, overridable per view.
8 FAVOURITES Drive the header switcher, ⇧1–8 and the Watch grid.
∞ SAVED PRESETS Snapshot a set, or hand it to someone else as a code.
DISCLOSURE

Partnerships and sponsors

4Xedge Bias Terminal may in future carry broker relationships in the form of sponsors, and we will name them plainly when we do. What will not change is that no instruction ever runs out to a broker. The platform reads prices and computes analysis on them — it never connects to a dealing desk, and it will never offer broker account API connectivity, order routing or execution of any kind. What you do with what you read is yours: you trade on your own platform, as you decide. Your details are never sold or handed to a broker, and nothing here is financial advice, a signal service, or a recommendation to enter or exit a position.

4Xedge Bias Terminal Framework

Five views over one measurement. Keys 1–5. Each one arranges the same numbers for a different question, so you find the answer in minutes rather than hours. One view, up to 10 Studies across 6 time frames with price alerts built in. Your system with honest math and zero emotion. Find the holes in your system*.

Read the whole framework →
The Matrix view: every study against every timeframe
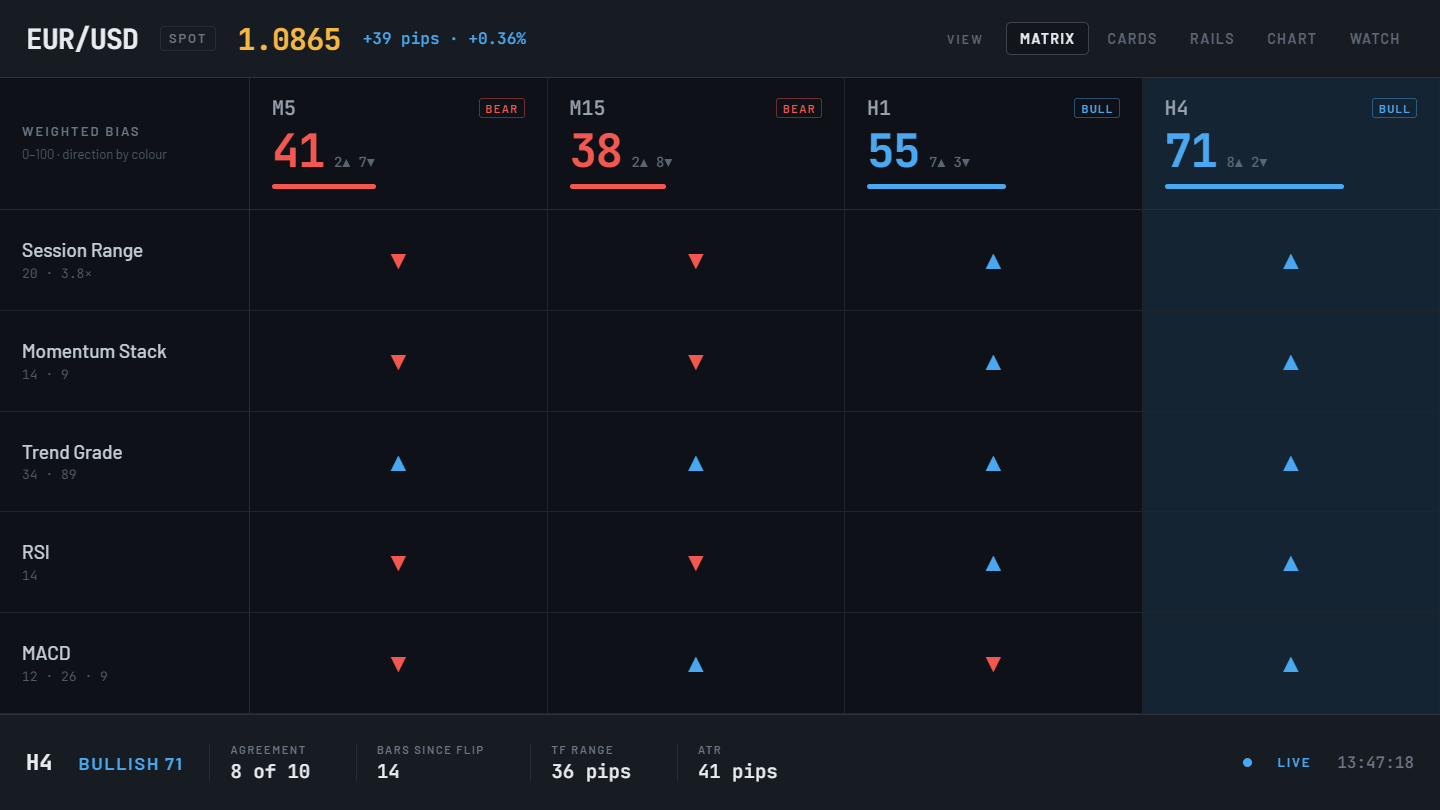
1 VIEW · KEY 1

Matrix

Every study against every timeframe, in one grid. Read agreement down a column, disagreement across a row — and see instantly which single period is turning before the rest of the stack does.

Open the Matrix view → ILLUSTRATIVE · NOT LIVE MARKET DATA
The Cards view: one card per timeframe
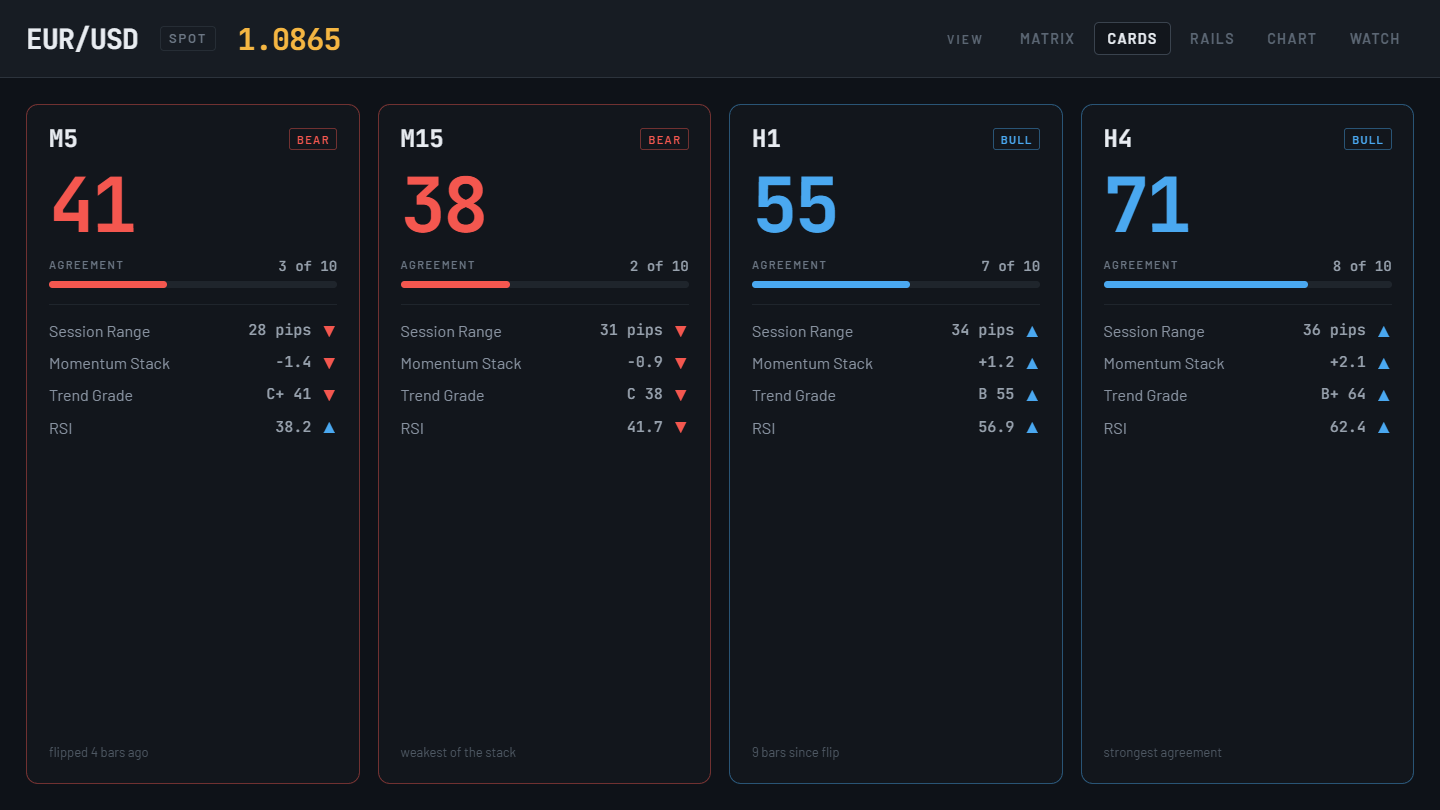
2 VIEW · KEY 2

Cards

One card per timeframe, read in parallel rather than scanned. Click any card for its full detail: the studies that reported, the ones that went silent, and the arithmetic between them.

Open the Cards view → ILLUSTRATIVE · NOT LIVE MARKET DATA
The Rails view: timeframes as diverging meters
3 VIEW · KEY 3

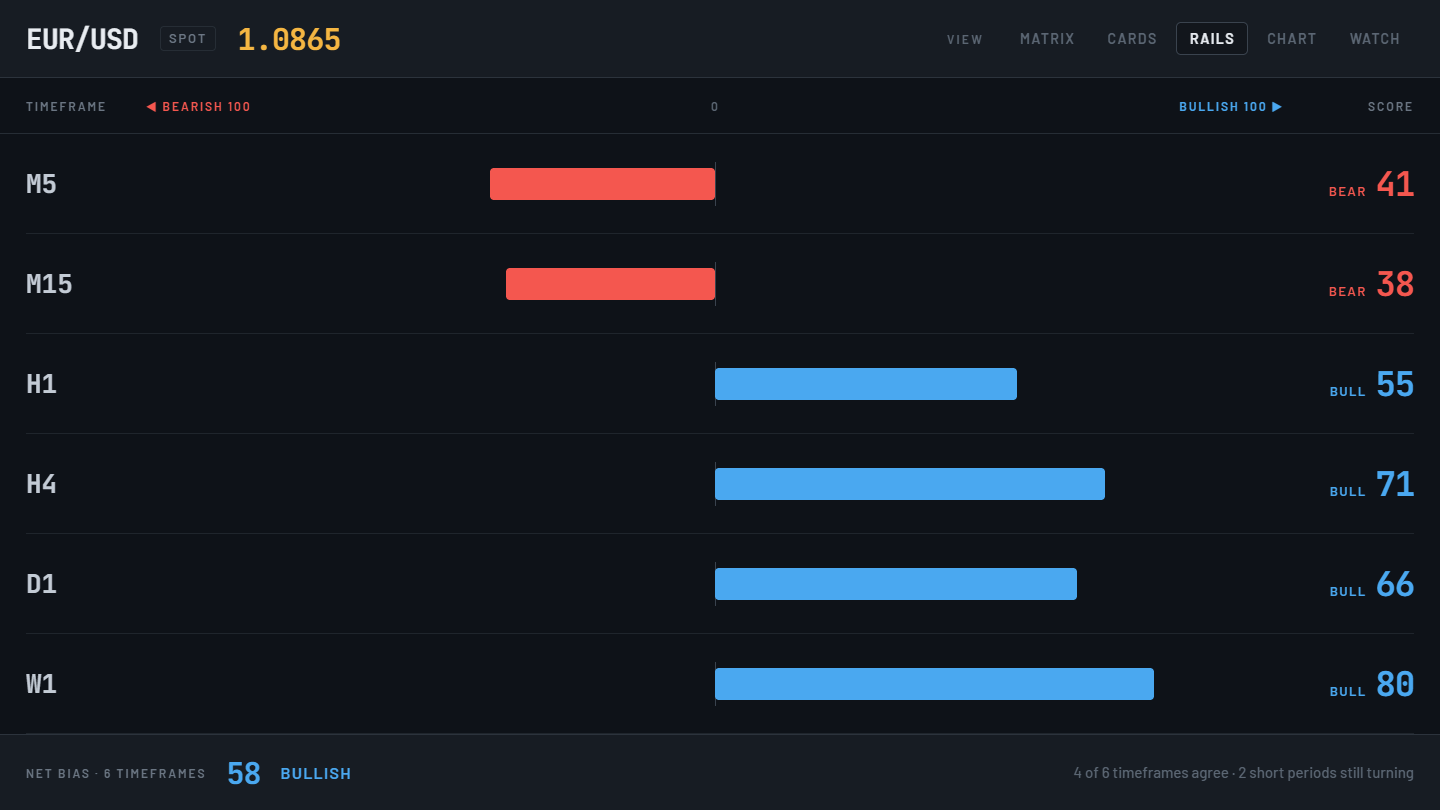
Rails

Timeframes stacked shortest to longest as diverging meters. The clearest look at the whole stack at once, and the fastest way to see a rotation working its way up the ladder.

Open the Rails view → ILLUSTRATIVE · NOT LIVE MARKET DATA
The Chart view: price with market position docked beneath
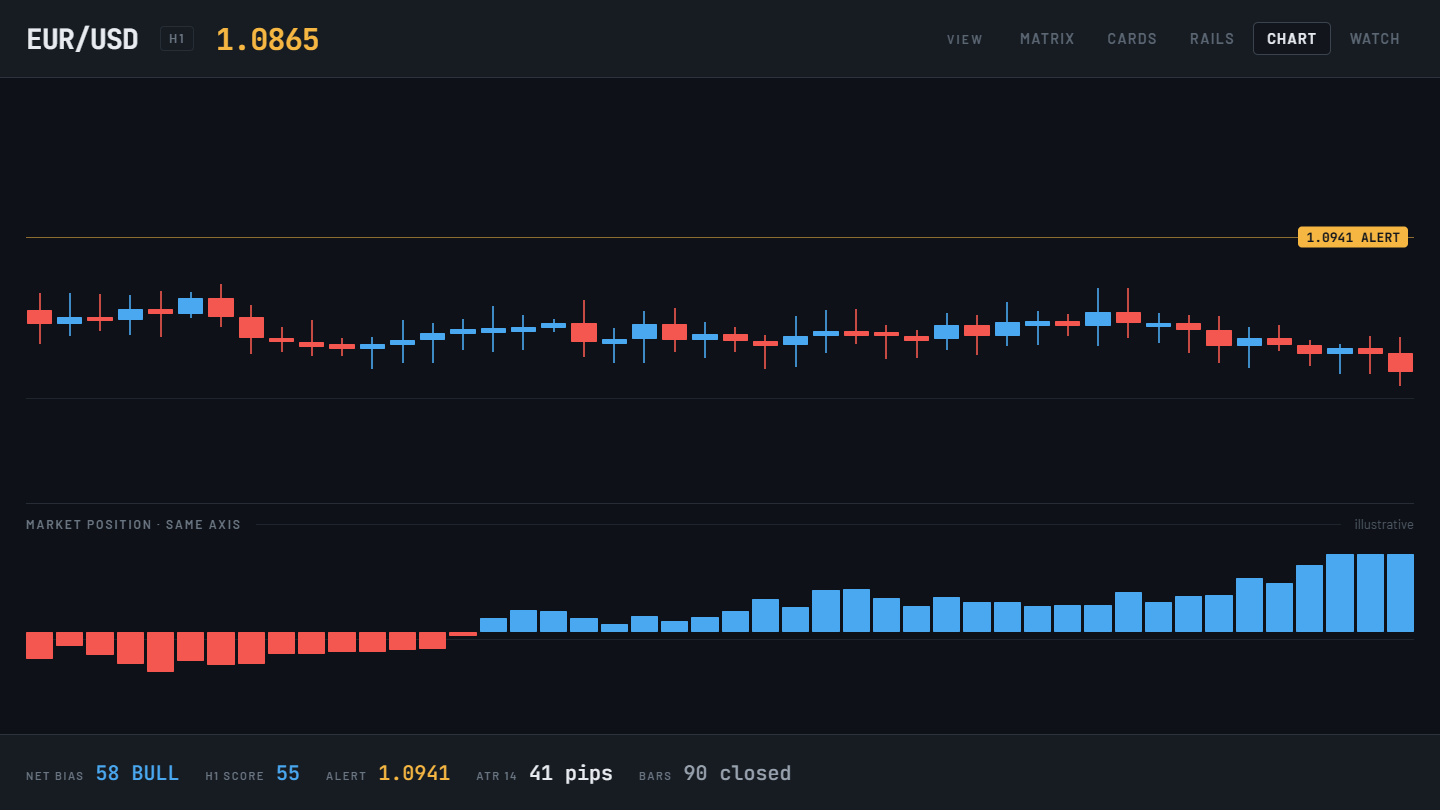
4 VIEW · KEY 4

Chart

Price with market position docked beneath it on one shared axis, plus your alert levels. The only view where the score and the candles are read against the same time cursor.

Open the Chart view → ILLUSTRATIVE · NOT LIVE MARKET DATA
WATCH A ROW PER SYMBOL ORDER, NOT RANKING
26 ROWS
FAVOURITES8 WATCHLIST26 WHOLE FEED102
SYMBOL PRICE NET BIAS DIRECTION AGREE
{{ r.sym }} {{ r.px }} {{ r.word }} {{ r.net }} {{ r.agree }}
The order is drawn once and held. Figures keep updating in place; no row moves under your cursor.
5 VIEW · KEY 5

Watch

A row per symbol, and the scope is yours — your eight favourites, your saved watchlist, or every symbol the feed publishes. Ordered by net bias, by agreement, by what just flipped or by what your studies cannot agree on, and held still so nothing moves under your cursor.

Open the Watch view → How Watch reads → ILLUSTRATIVE · NOT LIVE MARKET DATA
* Trading involves substantial risk of loss and is not suitable for all investors. Every reading shown is illustrative placeholder content. Past performance is not indicative of future results.

The bias score, in plain terms

The score is generated from the studies and periods you chose, not a blend we picked for you.
Up to six timeframes are read at once, from M5 all the way out to monthly — 23 periods available.
112 symbols on the house feed today: 60 FX pairs, 8 metals and 44 cryptocurrencies. M5 and H1 come from the feed; every other period is built here from them, and badged AGG.
Each reading is badged with whose engine produced it and whose prices it ran on.
No targets, no position sizing, no entry price and no gimmicks — this is a measurement, not a trade.
Your own studies from MetaTrader and TradingView already sit beside ours; your own symbols and history are next.

Here's the gist: the dangerous number is the one that still looks confident. When a study goes silent it becomes a hole, never a zero. When the feed goes quiet, every direction colour drains out of the screen so a frozen reading cannot pass for a live one. We would rather show you the gap than fill it.

STALE A frozen screen stops looking live.
When the feed goes quiet, every direction colour drains away across all five views at once. A dismissed warning must never leave a screen full of confident colour.
n/10 We show you the gap instead of filling it.
A study that is not reporting, or a timeframe short of history, is named as missing. Averaging the hole away would print a cleaner number, and that number would be a fiction.
AGG Every reading says where it came from.
If we built a period by folding shorter bars, it is badged. Every daily bar closes at 17:00 New York, for every instrument, and the weekly and monthly bars are made of those days.
i If it is our number, it explains itself.
Anything invented here carries a clickable explanation. Standard studies do not — an RSI means what it has always meant, and pretending otherwise is noise dressed up as help.
GO FREE

Get access to all five views.

No card. No trial. No upsell waiting at the end. Your configuration, favourites and presets are saved to your account, and we only ever email you about your account*.

* Tools do not guarantee profitable or successful trades.

Trading involves substantial risk of loss and is not suitable for all investors. You should make sure you understand the risks involved, seeking independent advice if necessary. Past performance is not indicative of future results.

Create your account
NAME
EMAIL
Desktop only — the terminal is built for a real screen and does not have a phone layout.

Straight answers

No, and it is built so it cannot quietly become one. The terminal measures how much of your chosen stack agrees right now and shows you the arithmetic. It never says buy, never says sell, never sizes a position and never tells you when to leave one. What you do with a reading is entirely yours.
Because it is supposed to be able to. The net spans every reporting timeframe, so a single short period turning first will contradict it — that is often the most useful thing on the screen, and averaging it away would hide the disagreement you came to see.
Four conventions, none of them maths: where the daily bar closes, whether the forming bar is counted, how much history the study warmed up on, and whose bid you are looking at. We exclude the forming bar, compute on closed bars, and label every reading with which engine produced it and whose prices it ran on — so a disagreement is explainable instead of mysterious.
Yes, beside ours. In the terminal, under Account, External studies, your own TradingView or MetaTrader study sends its values each time a bar closes, and they show beside our readings, marked EXTERNAL, for you alone; you can count them in your own bias numbers too. Your platform does the calculating; we store its values and their names, never your code. The house feed’s studies come from the library: you choose them and set each one’s parameters, and the same study can even fill two slots at different settings.
The status turns amber, then red, and every direction colour drains out of the screen so a frozen reading cannot pass for a live one. Past a threshold you get a blocking notice with the last good tick. When ticks resume, a ribbon tells you everything was recomputed — you are never left guessing whether what you are reading is current.
4Xedge BIAS TERMINAL
A multi-timeframe bias terminal for currency traders. Information only — not financial advice, not a signal service, and never a recommendation to enter or exit a position. You trade at your own risk.
Trader Risk Warning | Privacy Policy | Terms of Service | Copyright © 2026 – 4Xedge Bias Terminal · every price, score and chart on this page is illustrative placeholder content, not live market data.